Interactive graphs in statistics
Index
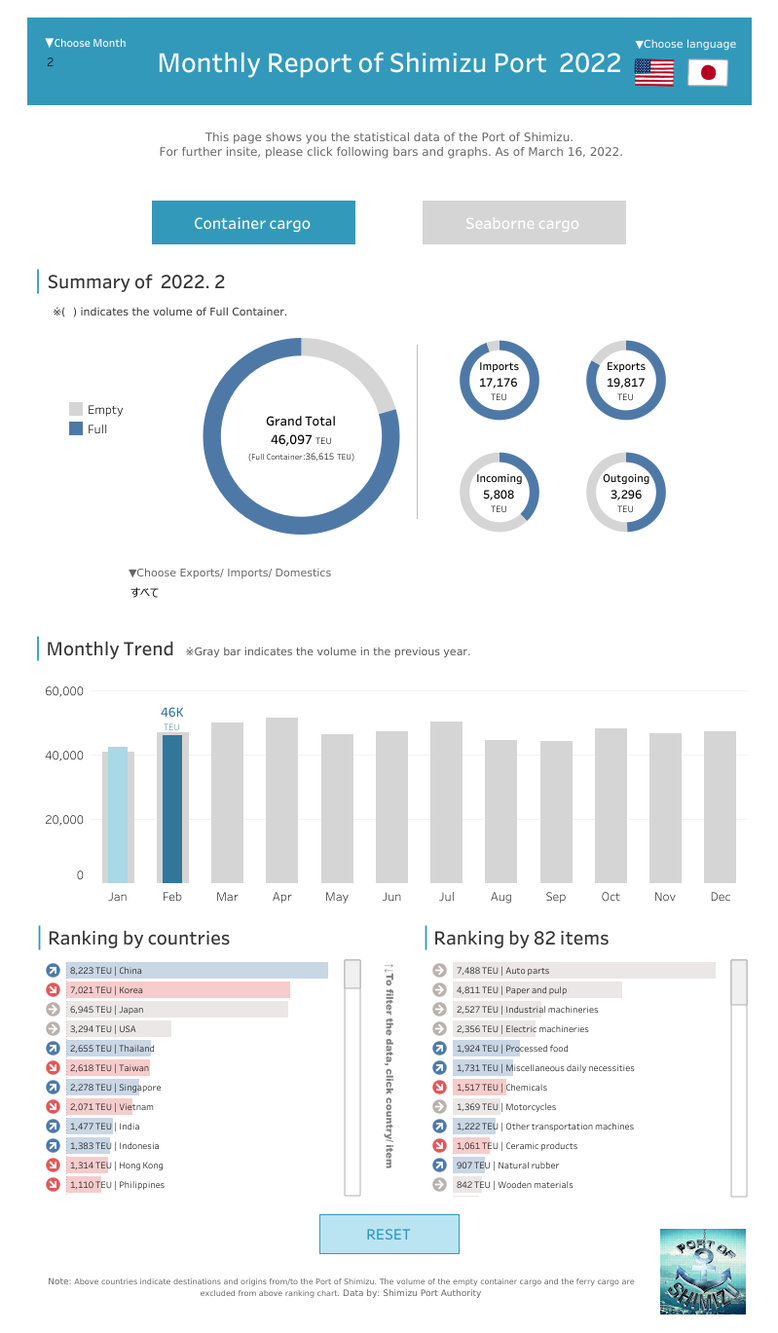
Monthly report
↓ Click the image to see the interactive graph with the Tableau public.
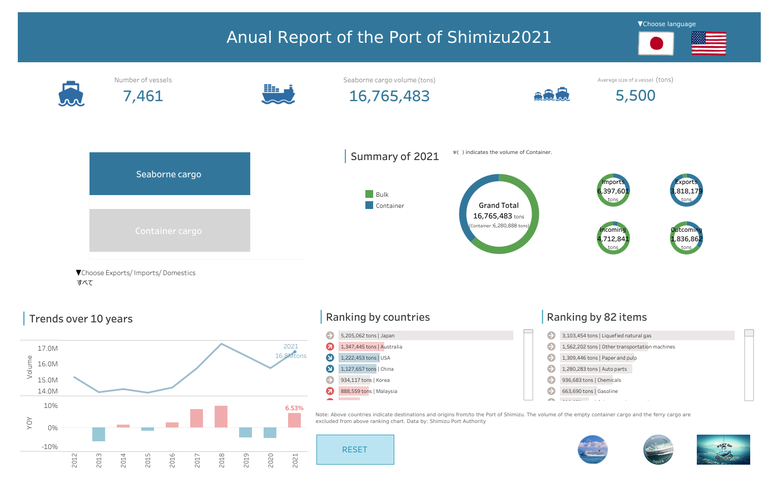
Annual report
↓ Click the image to see the interactive graph with the Tableau public.
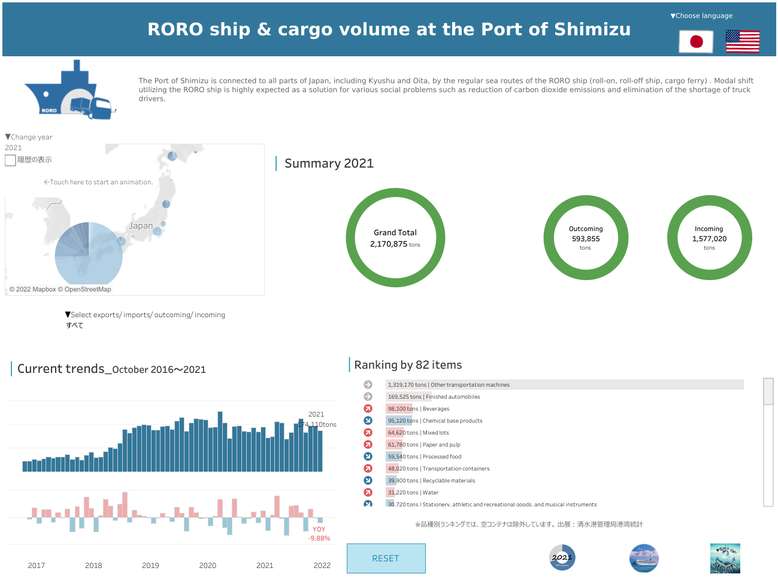
RORO ship & cargo volume
↓ Click the image to see the interactive graph with the Tableau public.
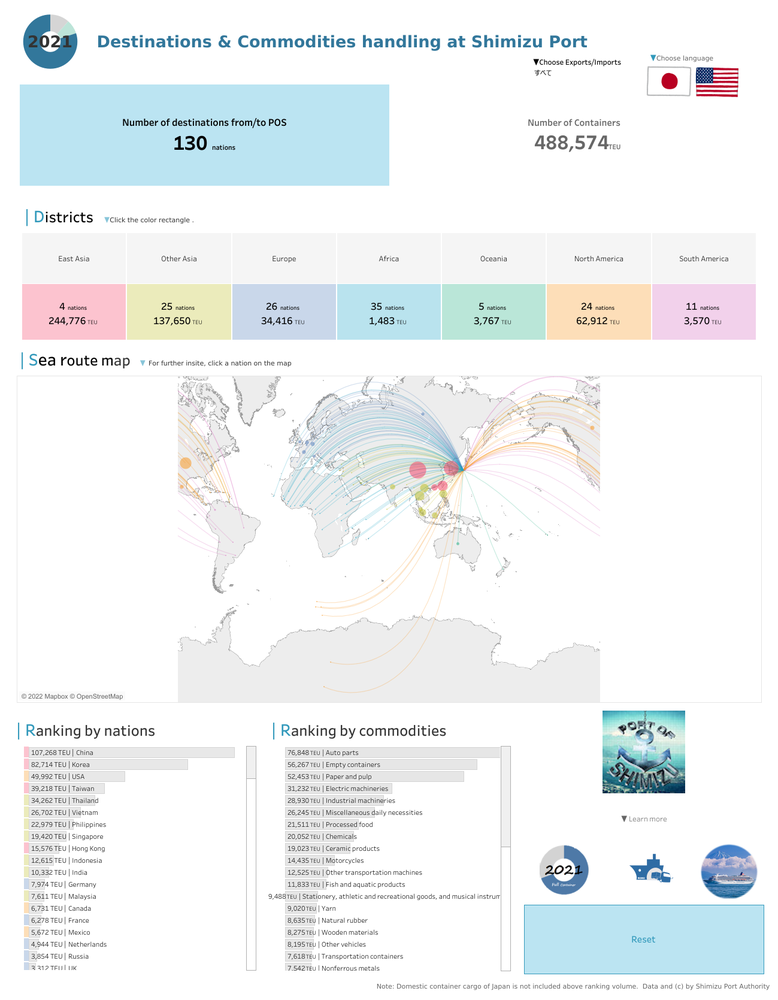
Destinations & commodities handling at Shimizu Port
↓ Click the image to see the interactive graph with the Tableau Public.